What is a correct way to draw event study plot when there is anticipatory effect?
I have done a simple Monte Carlo simulation with OLS and Callaway and Sant’Anna group-time ATT (henceforth called CS estimator) to find out what is a correct way to construct event study plot when there is anticipation. Note that I am only considering a situation with one treated unit, so there is no concern for heterogeneous treatment effect. The result shows that standard OLS event study specification produces unbiased estimates, while CS estimator requires adjustment of first treatment date. Otherwise, it produces biased estimates in posterior periods.
Data structure
- Units: 20 states with 1 treated state and 19 untreated states
- Time: 12 periods from -6 to 5.
- Shock: Main shock at period 0 and anticipatory shock at period -1
Data generating process
Outcome variable is a sum of following terms. Number of iterations = 1,000.
- state specific shock: drawn from unif([50, 100])
- date specific shock: drawn from unif([-5, 5])
- Treatment shock: Positive shock of +5 in period -1 and negative shock of -5 in period 0
- IID shock: drawn from standard normal distribution
Event study model
4 types of model will be estimated.
-
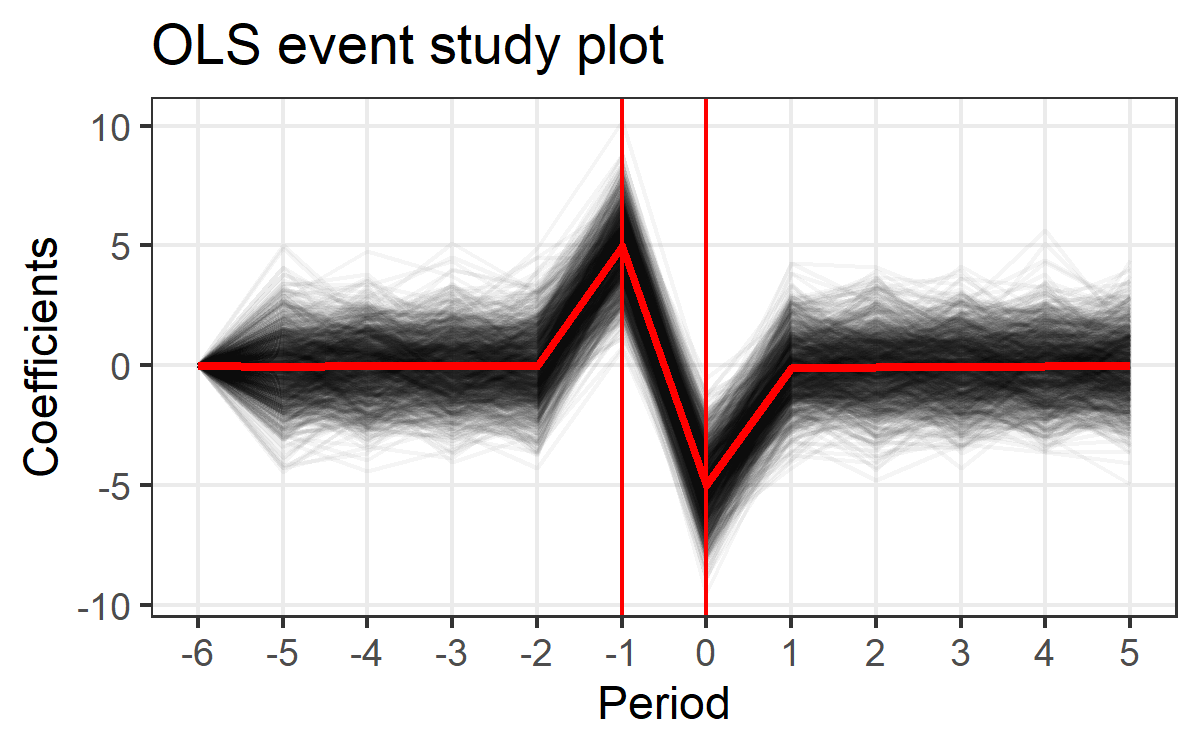
OLS event study model
\[y_{st} = \alpha_{s} + \delta_{t} + \sum_{k = -5}^{5} \beta_{k} D_{st}^{k} + \varepsilon_{st}\]
Reference category is period -6
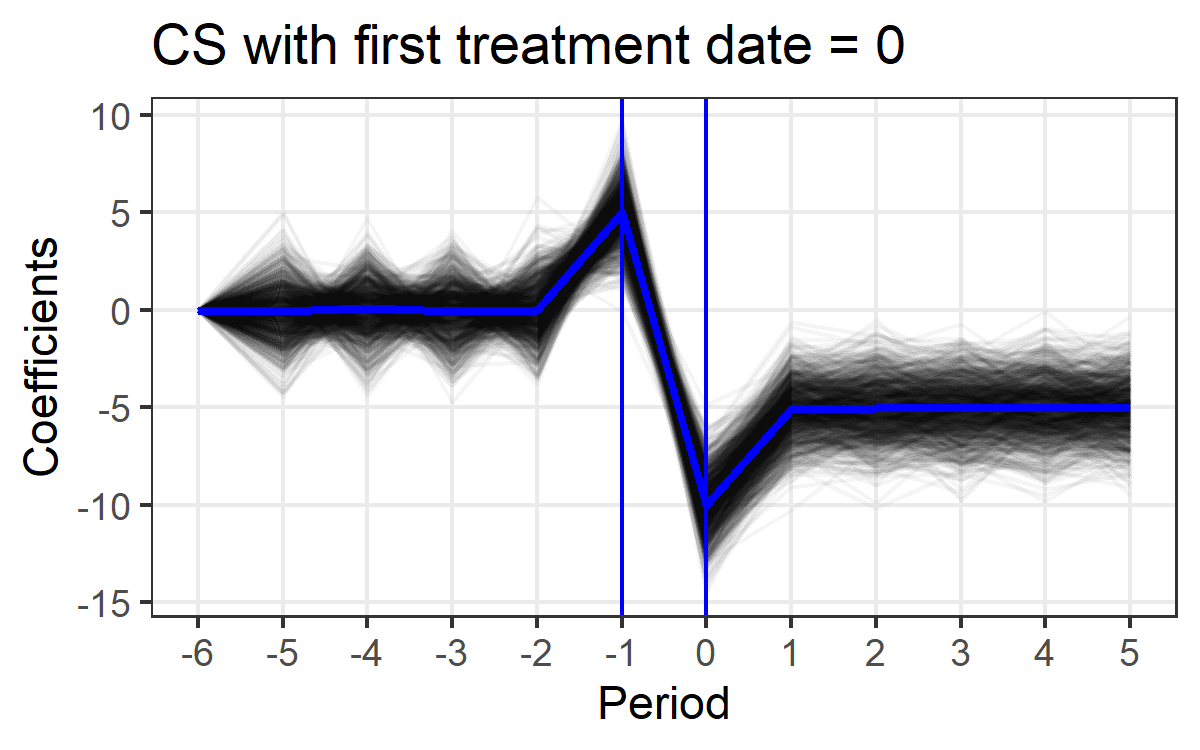
- Callaway-Sant’Anna event study with first treatment date = 0
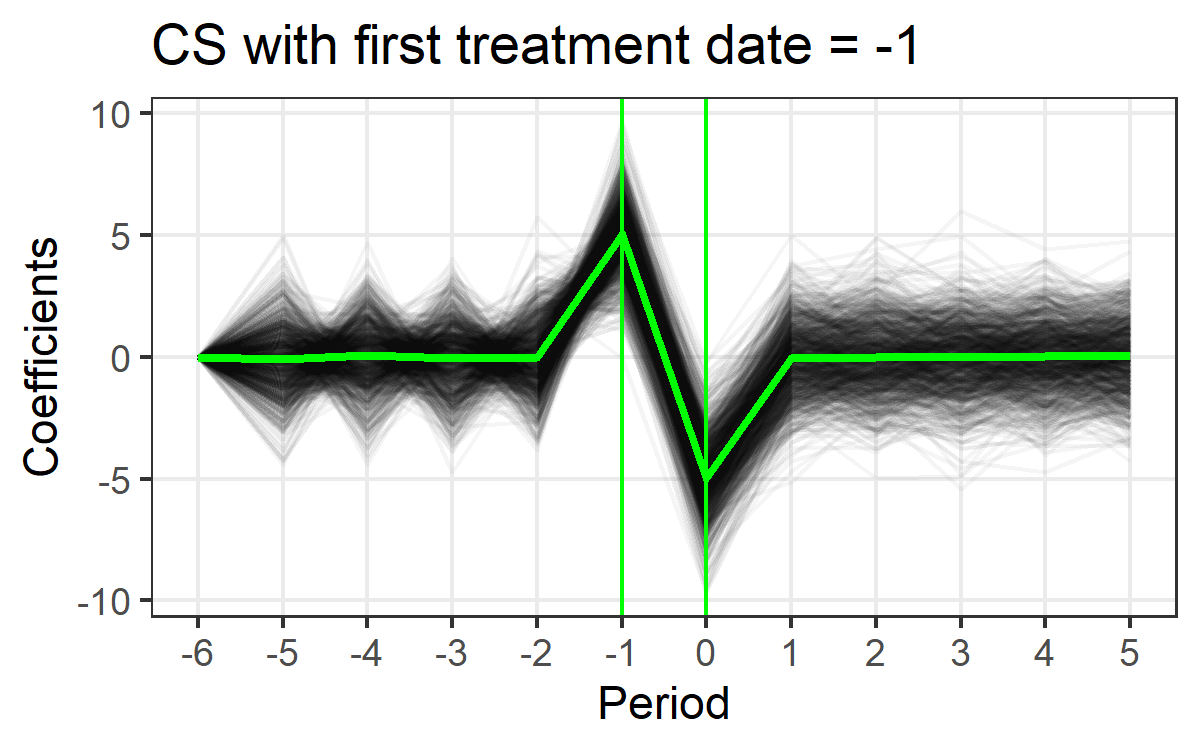
- Callaway-Sant’Anna event study with first treatment date = -1
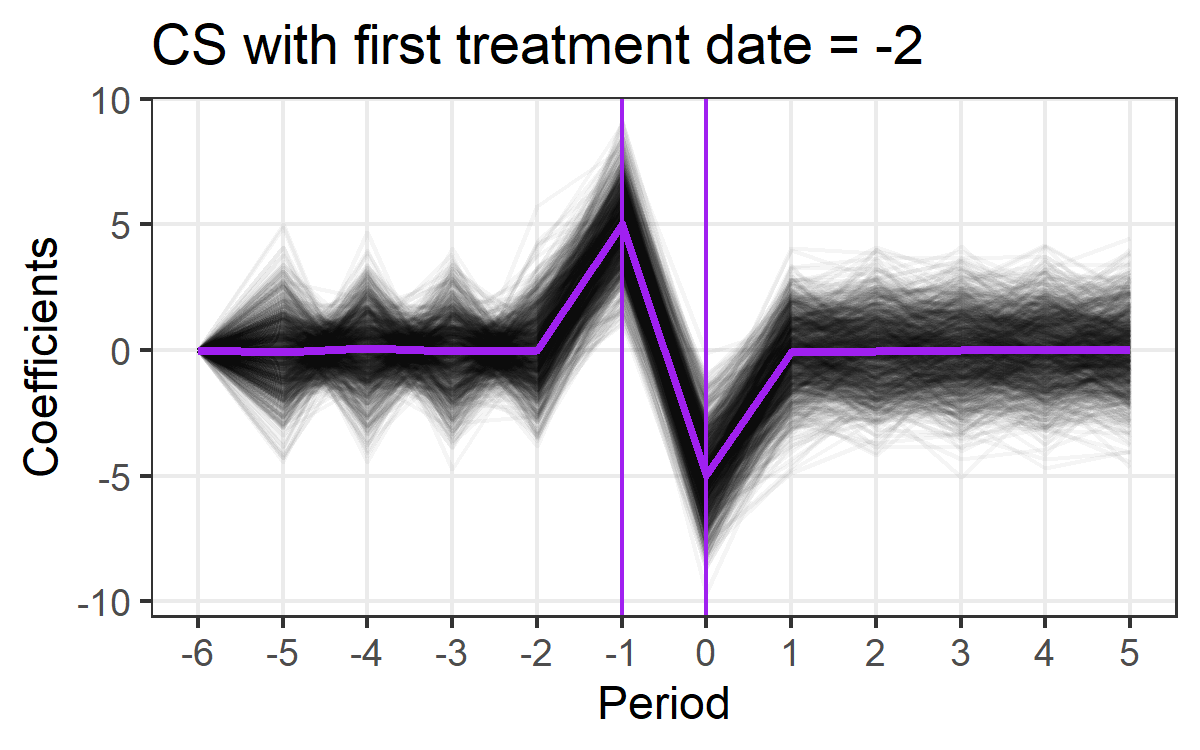
- Callaway-Sant’Anna event study with first treatment date = -2
Results
The Github page contain R codes for simulation and resulting event study plots. Colored line shows the average of 1,000 coefficients for each period.
1. OLS produces unbiased estimates.

There is only one treated unit and OLS does not suffer from heterogeneous treatment effects, differential treatment timing, etc.
2. CS estimator produces biased estimates when first treatment date = 0.

This happens from period 0 and persists in the following periods. This shows that failure to adjust first treatment date in the presence of anticipation will generate biased estimates in the following periods.
3. CS estimator produces unbiased estimates when first treatment date = -1.

Adjusting the first treatment date to be the date when anticipation starts to kick in can remedy the problem.
4. CS estimator still produces unbiased estimates when first treatment date = -2.

This shows when we do not have exact knowledge of when the anticipation can start to affect our outcome, it is better to be conservative and choose earlier date as first treatment date. It will still generate unbiased estimates. Another way to look at it is as a robustness check. When we move the first treatment date to one period before, the event study figure has to be robust. If this brings about a large change in event study plots, it means there is an anticipation effect that we did not expect. In such situation, CS estimator produces biased estimates and we need to check underneath what is really going on.